4. Project
Analysis - Discounted Cash Flow Analysis
4.1 Basic concepts
Frequently, cost analysis requires us to bring lumpy
outlays to some meaningful basis for comparison. For example, we might want to call
tenders for trash collection. We will need to know our annual cost of trash collection,
but several cost items in our internal costs are lumpy. We may buy new trucks only every
ten years; we may buy a compactor only every twenty years. How do we spread these costs
for the purpose of comparison? We may be looking at some minor capital works. Should we
insulate a building which will incur an expense now while saving money in future years?
How do we offset present outlays against future savings?
The main problem is the time value of money. An outlay
next year is less burdensome than an outlay now. An outlay now rather than next year has a
certain opportunity cost, for we could do something with that money in the meantime. We
need some means of bringing all cash flows to a constant base, and that is time is now,
the time of decision-making.
To do such analysis we need to be able to bring all flows
to a common point of time. Most frequently that is the present time - we find the present
value of a cash flow (or of a set of benefits or costs which can be brought
to dollar amounts). The key analytical concepts we use are:
• present value
- the flow of net costs or benefits brought to a present equivalent value;
• future value - a similar
concept, but bringing all values to some point in the future;
• discounting - the process
of reducing future values to present values. To do this we need a discount
rate.
All of these concepts become clearer when we look at them
in more detail. First, a revision of compound interest theory.
Interest and Future Value
Funds, when used to purchase productive assets like a
telephone company or a trash compactor, produce income, sometimes monetary, sometimes a
stream of services. Therefore borrowers pay and lenders or investors receive a return on
those funds. The rate of return, whether a return on debt or equity, is generally denoted
by the symbol r.(8)
Imagine an investment in which we keep re-investing our
money to get the same percentage return. Every year the funds are re-invested, to buy more
earning assets.
Using the symbol St to denote the sum we have
at time t, and St+1 to denote the amount we have at the next period, we can
construct a basic difference equation.
St+1 = St + return
= St + St * r
We can gather terms in our equation, to get:
St+1 = St * (1 + r)
If our funds could earn 7.5 percent, for example, the
relationship between one year and the next would be:
St+1 = St * (1 + 0.075)
= St * (1.075)
Imagine we start at time 0, and invest $1000 at 7.5
percent. Then after one year we will have:
S1 = 1000 * (1.075)
After another year it will be:
S2 = S1 * (1.075)
= S0 * (1.075) * (1.075)
= 1000 * (1.075)2
After seven years it will be:
= 1000 * (1.075)7
That superscript is a shorthand way of saying "to the
power of".
The general form of compounding equation is:
Sn = S0 * (1 + r)n
A common term for Sn is future
value. You may recognize the equation as the familiar compound interest
formula. The figure (1 + r)n is known as an accumulation factor;
it denotes the accumulation of $1.00 to its future value.
Now calculating a figure like 1000 * (1.075)7
by longhand could put a dent in anyone's leisure or work time. Till around thirty years
ago most people relied on compound interest tables. Then it became possible to do such
sums by repeated calculations on a desk calculator, while those who had access to a
computer could use Fortran, Basic or Cobol programs to solve such problems. Then came
programmable calculators and spreadsheets.
Using a spreadsheet for such a problem may sound like
using a sledge hammer to crack a peanut, but it has the benefit of allowing us to see
what's going on. What's happening at each stage of the process? Where are we at years 1,
2? What happens if I invest at 8.0 percent (but with a higher risk)? What if I draw off
$100 after two years? All these are easy to do, changing just one variable at a time.
When using a spreadsheet, remember that the syntax for
compounding, or exponentiation in most spreadsheets is the
symbol ^ (just above the 6 on the keyboard). Thus, if the interest rate were in the cell
B7 and the number of years were in the cell A12, the formula <=(1 + $B$7)^A12> would
give us the growth factor. (Alternatively you may give the cell B7 a name like
<interest>, in which case the equation becomes <=(1 + interest)^A12>.)
4.2 Discounting and net
present value (NPV)
We need a technique for bringing future savings, revenues
and costs to some present value as a basis of comparison. What
is $x in y year's time worth to us now?
To answer this we need to know by how much we discount
the future. This in itself is difficult to measure, an issue to which we turn at the end
of this Chapter.
As a metaphor, imagine that Great Aunt Clarabella has just
died, leaving you $5000, and her executors tell you it will take a year to wind up her
estate. What is that $5000 in a year's time worth to you now?
If you could get 7 percent on your money, then you would
find that present value by solving for x the equation:
5000 = x * (1.07)
That gives x = 4673. The figure 0.07 is called the discount
rate, also generally denoted by the symbol r
(though some writers use the symbol i). It is the opportunity
cost of capital - the opportunity foregone through not having the money now.
That is the return (interest, profit or capital gain) we could earn if we had the funds to
invest now.
Imagine the executors had said it would take two years.
Then we solve the equation:
5000 = x * (1.07) * (1.07)
5000 = x * (1.07)2
x = 1/(1.07)2 * 5000
x = 0.8734 * 5000
x = 4367
That figure 0.8734 is called the discount
factor, and is the factor by which we discount a cost, revenue or saving in n
years' time, to bring it to present value. It is generated by the equation:
Discount factor = 1/(1 + r)n
This is simply the reciprocal of the accumulation factor.
When we apply discount factors to cash flows in several
different periods, we can add up the present values to get a net present value
or NPV of the set of cash flows, or of any set of flows which can be expressed in
financial terms.
Use of Discounting in Investment Comparisons
Imagine we are buying a photocopier. We can buy a
photocopier for $1 500 which has a cost per sheet of 6.0 cents, or we can buy one for
$6 000 which has a cost per sheet of 2.0 cents. Given our volume of copying, we may need
to know which to buy, or we may wish to know at what volume the higher priced machine
becomes more economical. We are given, by the central finance authorities, a discount rate
of 8 percent. We would plan to keep our copier for five years, at which stage we would
expect to trade it in for 30 percent of its purchase price. We do 20 000 copies a year.
Which one should we buy? Or should we put our copying out to a commercial operator for 8
cents a sheet?
Our objective in this exercise is to choose the least cost
option of providing those 20 000 copies a year for the next five years. Therefore we
need to find the net present value of the cost of these three options, and choose the
option with the lowest NPV.
An extract from our spreadsheet is set out below. It is
useful to include the discount factor as an identified cell. The key calculations are to
obtain the discount factors by reference to the discount rate and the year, to multiply
the discount factors by the cash flow to get present values (also know as discounted
cash flows, DCF) and to add up these present
values to get the NPV of the set of cash flows.
Note that we have defined the first year to be year 0.
This is conventional in discounting models; we may equally have decided to call the first
year 1. Mathematically it would be a little different, but not greatly so. Whatever we do
we are approximating a continuous flow by a lumpy set of figures; we will use the
photocopier every day, not just at the beginning of each year as the model implies. This
approximation will not change our decision rules for the vast majority of projects. (For
funds managers, however, handling large amounts of money, precise timing is crucial, and
they may use daily or even hourly models, as when investing in the overnight money
market.)
Note, too, the distinction between the discount rate (8%)
and the discount factors (which are driven by the discount rate, and differ each year).
Note the distinction between present value (each year's outlay discounted) and the net
present value (the sum of these present values).
| Discount rate |
8% |
Photocopier
Outlays |
| Number of sheets |
20 000 |
| |
|
Copier 1 |
Copier 2 |
No copier |
| Year |
Discount factor |
Purchase disposal |
Copies |
Net outlay |
Present value |
Purchase disposal |
Copies |
Net outlay |
Present value |
Copies |
Present value |
| 0 |
1.0000 |
1500 |
1200 |
2700 |
2700 |
6000 |
400 |
6400 |
6400 |
1600 |
1600 |
| 1 |
0.9259 |
|
1200 |
1200 |
1111 |
|
400 |
400 |
370 |
1600 |
1481 |
| 2 |
0.8573 |
|
1200 |
1200 |
1029 |
|
400 |
400 |
343 |
1600 |
1372 |
| 3 |
0.7938 |
|
1200 |
1200 |
953 |
|
400 |
400 |
318 |
1600 |
1270 |
| 4 |
0.7350 |
|
1200 |
1200 |
882 |
|
400 |
400 |
294 |
1600 |
1176 |
| 5 |
0.6806 |
-450 |
1200 |
750 |
510 |
-1800 |
400 |
-1400 |
-953 |
1600 |
1089 |
| |
|
|
|
NPV |
7185 |
|
|
NPV |
6772 |
NPV |
7988 |
This shows that the net present value of the cost of the three options are:
Cheaper copier 7 185
Expensive copier 6 772
No copier 7 988
This gives a preference for the expensive copier, with a
low cost per page. A way of interpreting the figures is that if we outlaid $7 185
now, and spent some of this on buying the copier, some on copies as needed, and let the
balance accumulate interest at 8 percent, then we would exactly finance the operation. And
so on with the other two options.
Here it is worth mentioning the uses and abuses of forward
estimates, which are cash flow projections used in many government agencies.
They should not be used for evaluation. If we had been looking simply at cash outlays over
four years we would have found that the cheaper copier would have involved far less cash
outlay. This is an example of why we should not use forward estimates, which are no more
than cash projections, for comparative purposes.
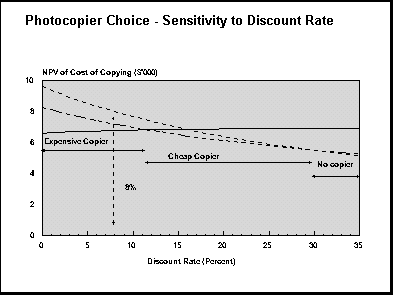
We should, of course, subject our model to sensitivity
analysis. What if we do only 15 000 copies a year (buy the cheaper
copier), if only 10 000 copies (no copier)? What if our discount rate rises to 10
percent (no change in decision). We should look at the effect of varying the discount
rate. At lower discount rates the expensive copier continues to dominate; at higher rates
the cheaper copier dominates, and at very high rates it's best to have no copier. These
zones are shown in the graph below. As a general rule low discount rates favor investments
with a high ratio of up-front to running cost, and as the discount rate rises we are
willing to incur high ongoing costs in the future in favor of lower outlays now. (To
generate a graph similar to this you will need to use the Data Table
function in Excel.)
This sort of decision is common in the public sector. We
have little choice about whether to undertake an activity or not; we need therefore to
find the lowest cost means possible to achieve a given outcome. (It is a form of
cost-effectiveness analysis, in answer to the question "what is the lowest way of
financing a given number of copies?".) In more commercial situations, where we can
put a price on our output, we follow the fundamental rule of benefit-cost analysis, and
select the project with the highest net value.
 DCF analysis is a standard technique,
even for minor decisions (e.g. down to $1000) in the private sector. It is used in the
public sector, but its use is confined mainly to large projects. There is no reason for
not using it, however; the reasons it is not used seem to be a lack of familiarity with
the technique and often an undue obsession with immediate cash outlays.
DCF analysis is a standard technique,
even for minor decisions (e.g. down to $1000) in the private sector. It is used in the
public sector, but its use is confined mainly to large projects. There is no reason for
not using it, however; the reasons it is not used seem to be a lack of familiarity with
the technique and often an undue obsession with immediate cash outlays.
DCF analysis is a fundamental tool in benefit-cost
analysis, except in the cases where costs and benefits occur all in the same year.
Sometimes discounting is done on the costs and benefits separately; that is, a NPV of
costs is determined, and a NPV of benefits is determined, and the two are compared. The
NPV following such a manipulation is no different from the NPV of net cash flows, in which
costs and benefits are offset before discounting. Finding the NPVs of the two streams,
however, does allow for calculation of benefit-cost ratios.
Also, although the term "discounted cash flow"
is used, this is more to describe a technique rather than to imply that the costs and
benefits have to be actual cash outlays or receipts. In the private sector projects can
usually be evaluated simply by considering cash flows. In the public sector, however,
while costs and benefits may be tangible and measurable in dollar terms, there is often no
cash flow. In a transport model we would include travel time savings, for example, as if
these were actual cash benefits to the users concerned, although there would never be a
cash transaction. Similarly, if our project involved some loss of environmental amenity,
we would try to give it a dollar value as an outlay, even though we never make the
transaction. Restricting our analysis to actual cash flows is to restrict our evaluation
to a financial evaluation; public policy should rest on economic
evaluation.
This exercise is typical of the exercises we need to do in
comparing in-house bids with external bids. It illustrates two issues in the comparison:
(1) Low volumes tend to favor the "contracting"
out option (no copier).
(2) A high discount rate tends to favor contracting out.
We have dealt with the first of these issues. On the
second, there is often a tendency to use a higher than necessary discount rate in finding
internal costs; such an error tends to introduce a bias in favor of contracting out.
Leases
Government agencies are often attracted to leasing as a
means of conserving scarce cash resources. Basically, there are two forms of lease - an operating
lease and a finance lease. In an operating lease
the leasing firm provides not only the leased equipment but also all associated services.
For example, an agency could enter an operating lease deal to have a firm provide all its
cars, including maintenance and repairs, in much the same way as one may rent a car from
Hertz or Budget. A finance lease is simply a financing deal. The asset passes into the
care of the agency, and there are usually no associated services.
Operating leases often make good sense, especially if an
agency doesn't have scale economies in maintaining equipment. Finance leases, on the other
hand, are simply a way of borrowing money. When finance leases are offered one can use DCF
analysis to calculate lease versus buy options, and can find at what rate of interest the
NPV of the finance lease equates to the outright purchase option. One usually finds that
the effective rate of interest on a finance lease is well above what a government agency
pays on its borrowings.
4.3 Annuities and sinking
funds
Discounting provides a means of taking flows of costs and
benefits over time and converting them to a single lump sum at the beginning of the period
so we can compare different projects. Suppose, however, we have a different sort of
problem. We may know the NPV of the in-house option over n years, but have to
compare that with a regular outlay for an external contractor. Or, if we are thinking of
setting a price based on cost, what is the annual cost on which to base our pricing when
our operations involve lumpy costs? Two techniques an help us solve such problems.
Annuities are about the process
of converting a lump sum into a constant flow over a period. Sinking funds
are not about bottom-of-the-harbor tax evasion; they are about converting a lumpy set of
outlays into a smooth flow, or accumulating enough money for an expected future outlay.
Annuities
Many people, on retirement, choose (in fact are strongly
persuaded by superannuation and tax legislation) to convert lump sums into annuities.
If we retire with a lump sum we would like to spin that lump sum out over our remaining
life. We can certainly draw the real interest component, but how fast can we draw down on
the capital component? A benefactor may leave an endowment to a university to fund a chair
for, say, twenty years. How fast can the university draw on the fund? Basically an annuity
is an investment in which we invest a sum S now, or at time 0, and every year,
for n years, draw off a certain amount A. Usually we know S, n,
and r, the rate of return; our task is to find A.
To illustrate, imagine we have accumulated $200 000
in a superannuation policy, and expect to live for twenty years. What can we draw off that
policy each year while making sure we leave nothing to the next generation? The discount
rate is 5 percent.
We know that if we were to live forever, or if we wanted
to leave $200 000 in our will, we could draw off $10 000 a year. We should be able to do
better than that however. We know that if we simply drew down our capital we could draw
$10 000 a year. But we cannot draw down capital and take interest on the full amount
- we cannot have our cake and eat it. The amount of drawing we can sustain over twenty
years has to be somewhere between $10 000 and $20 000.
Now the lump sum amount S is
simply the present value of our sustainable cash flow of A for
n years, starting at the end of this year.(9)
Then we can simply expand this out as a standard net present value formula:
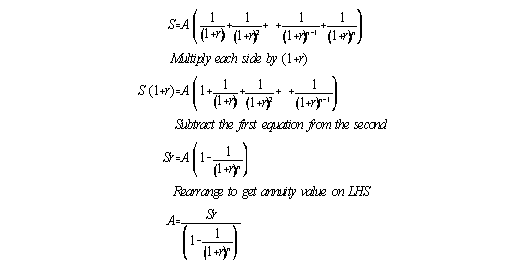
In the case of a twenty year annuity, substituting n = 20, r = .05, and S
= 200 000, we get A = $16 050.We can see from the formula that as n
gets very large then the denominator approaches 1. The formula then becomes simply A =
Sr, which is the familiar simple interest formula.
If we were not sure we were going to live twenty years, we
could, for a management fee, buy a lifelong annuity. These are sold by funds managers, and
annual payments are based on statistical life expectancy. If we live for ten years only,
bad luck. If we last for thirty years we spend our dotage subsidized by those who went
before.
We may find the annuity formula looks a bit formidable. We
may find it easier, and more transparent, to use a spreadsheet, and to set up a difference
equation model, manipulating the draw off amount A until we have exactly zero
after twenty years - a 'suck it and see' approach, which is quite valid mathematically.
(Mathematicians use the term iteration, rather than "suck
it and see".) For each year we start with an opening capital sum, add the interest,
subtract the drawing, and get the residual sum, which becomes the capital for the
following year. Using the goal seek function in a spreadsheet we
can ask the spreadsheet to do the iterations for us.
Sinking funds
A sinking fund is a fund to
which we make regular payments to meet large expenses in the future. It is a common way of
accumulating funds for major building maintenance and refurbishment.
We can develop an accumulation spreadsheet for a sinking
fund for a once-off major outlay, but if our outlays are lumpy and irregular (e.g. paint
every five years, re-roof every thirty years), then our easiest approach is to use a set
of difference equations in a spreadsheet.
An example illustrates the point.
In the new Canberra suburb of Gorton, just south of Yass,
the water supply authority has installed new pipes, header tanks, pumps etc.
They estimate the assets will last 30 years before needing
replacement. Also, for the first few years, the assets will require virtually no
maintenance. They estimate that the following outlays will be required:
Years 1 to 9 - no maintenance
Years 10 to 19 - $2 million a year maintenance
Years 20 to 29 - $3 million a year maintenance
Year 30 - complete replacement of system for $30 million
They envisage they will have to contribute somewhere
between $1 and $2 million a year, and, in order to keep good relations with ratepayers,
they want to make sure the contributions start straight away and are the same each year.
They can get a real return of five percent for any funds they set aside in a sinking fund.
The first twelve and last three rows of the spreadsheet
are shown below. The example below shows a trial contribution of $1.70 million a year,
which gives an amount leftover of exactly zero at the end of the period.
| Sinking
fund contribution rate $m |
1.70 |
|
| Interest |
5% |
|
| Year |
Balance beginning of year |
Interest |
Contribution |
Drawing |
Balance end of year |
| 1 |
0.00 |
0.00 |
1.70 |
|
1.70 |
| 2 |
1.70 |
0.08 |
1.70 |
|
3.48 |
| 3 |
3.48 |
0.17 |
1.70 |
|
5.34 |
| 4 |
5.34 |
0.27 |
1.70 |
|
7.31 |
| 5 |
7.31 |
0.37 |
1.70 |
|
9.37 |
| 6 |
9.37 |
0.47 |
1.70 |
|
11.53 |
| 7 |
11.53 |
0.58 |
1.70 |
|
13.80 |
| 8 |
13.80 |
0.69 |
1.70 |
|
16.19 |
| 9 |
16.19 |
0.81 |
1.70 |
|
18.70 |
| 10 |
18.70 |
0.93 |
1.70 |
2.00 |
19.33 |
| 11 |
19.33 |
0.97 |
1.70 |
2.00 |
19.99 |
| 12 |
19.99 |
1.00 |
1.70 |
2.00 |
20.68 |
| 28 |
26.88 |
1.34 |
1.70 |
3.00 |
26.92 |
| 29 |
26.92 |
1.35 |
1.70 |
3.00 |
26.96 |
| 30 |
26.96 |
1.35 |
1.70 |
30.00 |
0.00 |
A completed spreadsheet does not show the steps in
constructing it. You start with the second last column - the drawings, and incorporate
these into the difference equations - open balance, plus interest, plus regular
contribution, less drawing, equals closing balance. How do we know a regular contribution
of $1.70 million will exactly balance the fund? We don't. You have to experiment with
various rates of contribution to get it right with a zero balance after you have drawn off
the $30 million at the end of year 30. The answer is a regular annual contribution of 1.70
million.(10)
The benefit of a sinking fund for GBEs is that it allows
them to accumulate reserves for projected maintenance and replacement works; they do not
have to raise rates dramatically or go cap-in-hand to the finance authority when it comes
time to make major outlays. It also ensures present users contribute to expenses they
accrue but do not realize. The cost is that, unless the fund is well protected, the
government can pillage it for current consumption or to close a budget deficit, especially
if the entity is not off-budget. Replacement of ageing infrastructure is a major problem
in many of the world's older cities; in new cities, like Canberra, the problem is more
likely to be that present taxpayers are not paying adequately for future maintenance,
upgrading and replacement.
4.4 Choice of discount rate
In most investment decisions the main items of sensitivity
are the revenue and the choice of discount rate.
It is customary to use a real,
rather than a nominal discount rate in such analysis. In brief,
the real discount rate is the nominal rate less inflation.(11)
In that way we can do our analysis without having to worry about inflating our cost and
revenue elements - all costs and prices can be expressed in constant price terms.
If you are having trouble thinking about real, as opposed
to nominal, rates, think about a pensioner living off a lump sum. If she had, say,
$300 000 to live off, and did not wish to deplete her capital, how much could she
draw each year if nominal rates were 12 percent and inflation was 7 percent? The answer is
$15 000, or 5 percent of $300 000. Actual interest paid would be $36 000,
of course, but inflation has eroded her capital base by 7 percent, or $21 000. She
has to put that $21 000 back into the capital base to maintain its real value,
leaving her with $15 000 to draw.
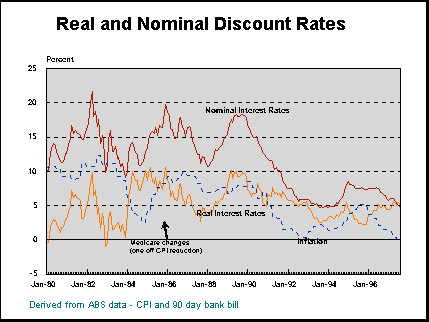
Real interest rates (upon which the real discount rate is
based) have been volatile in Australia over the eighties, reflecting the use, by
successive governments, of monetary policy as a major instrument of economic regulation.
Over the long term they average around five percent, but in the short term financial
regulators may manipulate rates to influence investment activity. (The effect is mainly on
investments with short payback periods, for long-term investors are more interested in
long-term interest rates.) Over much of the eighties the western world was gripped by a
dogma that government projects were somehow of less value to the community than private
enterprise projects; central agencies therefore set very high hurdles for government
projects - as high as a ten percent real discount rate - to ration government capital
expenditure.
 It is questionable whether government authorities
should include a premium for risk when choosing a discount rate. In commercial markets
lenders always apply a premium for risk. Government securities bear virtually no risk
premium; bank bills bear very little. Building society deposits, credit union deposits,
unsecured notes, shares, all bear higher risk premiums, depending on the riskiness of the
projects in which the institutions lend or invest.
It is questionable whether government authorities
should include a premium for risk when choosing a discount rate. In commercial markets
lenders always apply a premium for risk. Government securities bear virtually no risk
premium; bank bills bear very little. Building society deposits, credit union deposits,
unsecured notes, shares, all bear higher risk premiums, depending on the riskiness of the
projects in which the institutions lend or invest.
Conventionally, governments used not to apply a risk
premium, but now a risk premium is implicit in most discount rates set by central
agencies. International credit rating agencies, like Moodys, assess the risk rating of
governments, and these flow through to discount rates. Government projects obviously vary
in their riskiness - an investment in a road in a congested city is far less risky than an
investment as a capital injection to a government owned airline. In general GBEs should
use commercial rates, including a premium for risk.
When real interest rates are high, there can be
difficulties in choosing an appropriate discount rate. Taking an opportunity cost
approach, we should use the opportunity cost of capital - that is, the rate we could get
on long term risk free investments - as our benchmark rate. This is sometimes called the social
opportunity cost of capital.
On the other hand, many desirable projects would simply
not get off the ground at real discount rates as high as 5 or 8 percent. People want to
make investments in schooling, environmental protection, or culture, returns from which
may not be realized even for generations. In the past communities have embarked on
projects which would take hundred of years to complete, such as medieval cathedrals. These
decisions, if taken democratically, are governed by a social rate of time
preference, which is never zero (our planet may be hit by an asteroid
tomorrow), but is often as low as one or two percent, as is revealed by society's choices
on education, training etc.
Any notion, therefore, that choice between competing
projects, or the decision whether to undertake a project at all, can be resolved by
recourse to technocratic reductionism, is incorrect. We cannot just take a directive from
headquarters and plug it into our models.
Exercises
1. Returning to our hot water system. Hot water systems
last around fifteen years. Solar systems are expensive to install, but reasonably low cost
to run (they need boosting in winter and on dull days). Electric heaters cost much less to
install, but they cost more to run.
Imagine a household has a choice between a solar system
which would cost $2000 to install but only $100 a year to operate, and an electric system
which would cost $500 to install but $300 a year to operate. Which system has a lower NPV
of cost?
Modelling this choice over 15 years (years 0 to 14) you
will find the solar system has a lower NPV at low discount rates - up to 10.2 percent.
(This illustrates the general principle that as discount rates rise we tend to favor
decisions which sacrifice future gains for immediate benefits.)
2. The Shire of Wanton Valley (a tax exempt organization)
wants to put up a 35 bed private nursing home. It must be an economically justifiable
project.
The revenue per resident it will get is $20 000 a year,
and there will be no trouble filling it. The shire can plan on all beds being full and
earning money once construction is completed, which should take about a year.
The architect has presented two options:
The first has a low construction cost ($1.4 million). Its
running costs will be $430 000 a year once completed and occupied. It is a
conventional building.
The second is a higher cost option ($2.3 million). Its
running costs, however, will be $130 000 a year lower, as it will incorporate solar energy
systems, low maintenance materials, a layout to make for easier cleaning, and a kitchen
with significant labor savings.
Demographic projections suggest that in eight years time
the north coast may have become yuppified. So in the interests of conservatism the
Council's projections are going out no more than eight years from construction, which will
take a year. At the end of the eight year period the cheaper building would have no value,
but the other building would have a disposal value (for conversion to a motel) of
$200 000. The projected cash flows in $'000 are:
| Year |
Option 1 |
Option 2 |
| Outlay |
Revenue |
Outlay |
Revenue |
| 0 |
1 400 |
0 |
2 300 |
0 |
| 1 to 8 |
430 |
700 |
300 |
700 |
| 8 (disposal) |
|
0 |
|
200 |
The real cost of capital (the opportunity cost on other
projects) is 5 percent. What is your advice to the shire?
You will find, at low discount rates, the preference is
for the more expensive institution; above 6.8 percent and up to 10.8 percent the less
expensive option has a higher NPV, and at higher rates neither has a positive NPV.
3. The VFT project between Melbourne and Sydney was found
by the private sector consortium not to be a financially viable
project. But many economists believed it was (and still is) an economically
viable project. What explains this apparent difference?
4. In 1991, the ACT Electricity and Water Authority
offered ratepayers the choice of paying water and sewerage charges in one hit, with a five
percent discount, in late September, or spreading the full amount over four equal payments
in late September, late November, late January and late March (three payments of $102, and
a fourth of $104). If you were a ratepayer in the ACT, which would you choose? Set up a
model to find the value or penalty in early payment. (As a hint, it's quite valid to use
partial years in calculating discount factors. N does not have
to be an integer.)
You will find that the discount rate which reduces the
difference between immediate payment and the NPV of time payment to zero is 23 percent.
What explains such a high discount rate? Was the opportunity cost of funds for the ACT
Government really 23 percent, or are there other factors which may explain such a high
figure?
5. In the sinking fund model, we assumed the fund was
there to replace existing infrastructure, and found a
contribution rate of $1.70 million was necessary to provide funds to cover maintenance and
eventual replacement. Show that if the residents have to pay back a loan
of $30 million for infrastructure already provided - that is, shifting the $30 million to
the beginning rather than the end of the project, then the sinking fund contribution rate
rises to around $3.1 to $3.2 million (depending on the precise timing of the $30 million).
6. A firm offers a photocopier on the following terms. Buy
outright for $2950, or lease at $24 per week for three years with a ten percent residual
payment ($295) at the end of the period. Show that this represents an effective rate of
around 23 percent.
Notes
8. Some writers use the symbol r,
others the symbol i, which strictly equates to the specific
entity interest. The term r, short for
return, is more general, and can refer to return in the form of
interest, dividends or capital gain on loan or equity investment. It can also refer to
non-financial returns.
9. This assumes that the last payment of A will come on our
dying day - not a great way to organize our finances. We could use it for a funeral and
wake. Alternatively we could work on a timing of (n-1).
10. The answer is $1.69547328124984 million, for those who enjoy
precision.
11. This represents a minor simplification, in that the nominal
rate comprises not only the real rate plus inflation, but also a cross product, being the
combined effect of inflation and the real rate. This cross product is usually so small
that it can be safely ignored. The inflation assumption is far from unambiguous - it
relates to the inflationary expectation over the same period as the discount rate is
chosen - thus to get a real discount rate from looking at a ten year Treasury bill, we
would have to guess what inflationary expectation is built into that rate.
Go to next chapter